Feature · Monitor
Runs, pass rate and findings, week by week
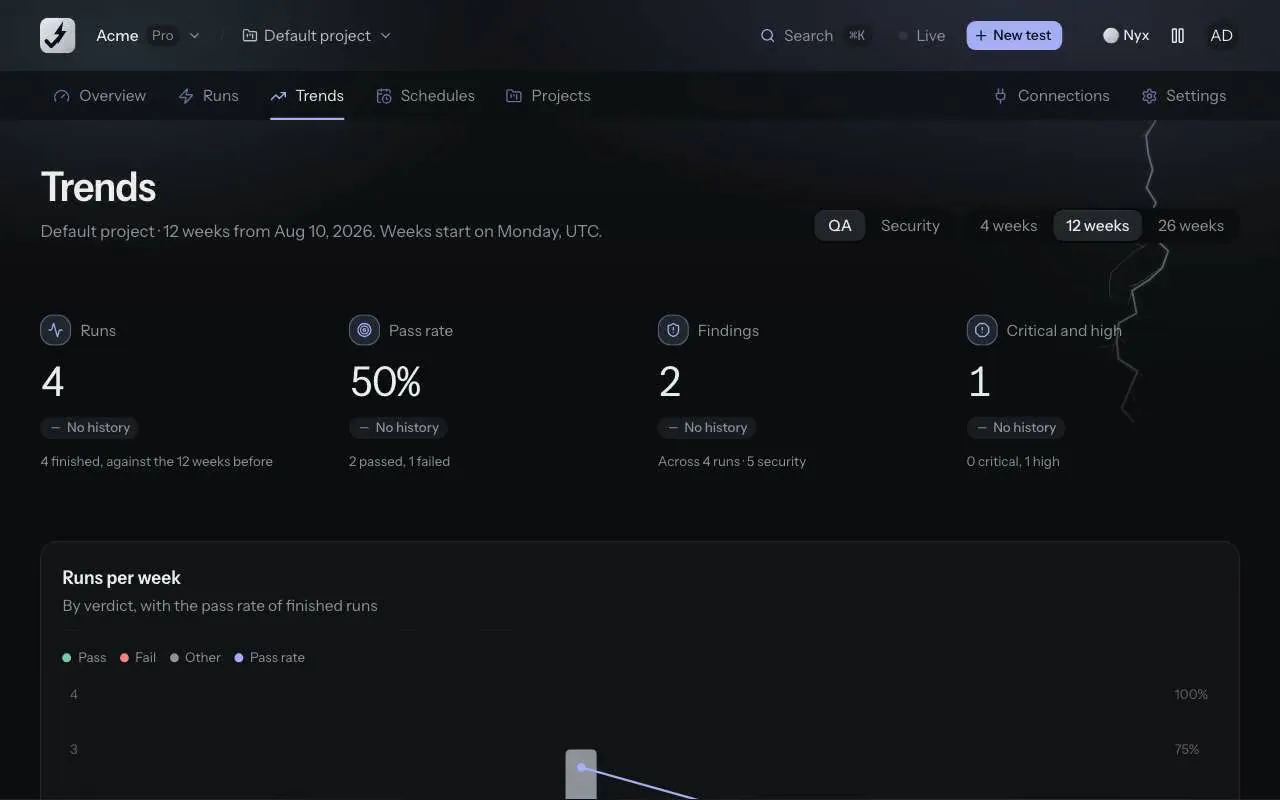
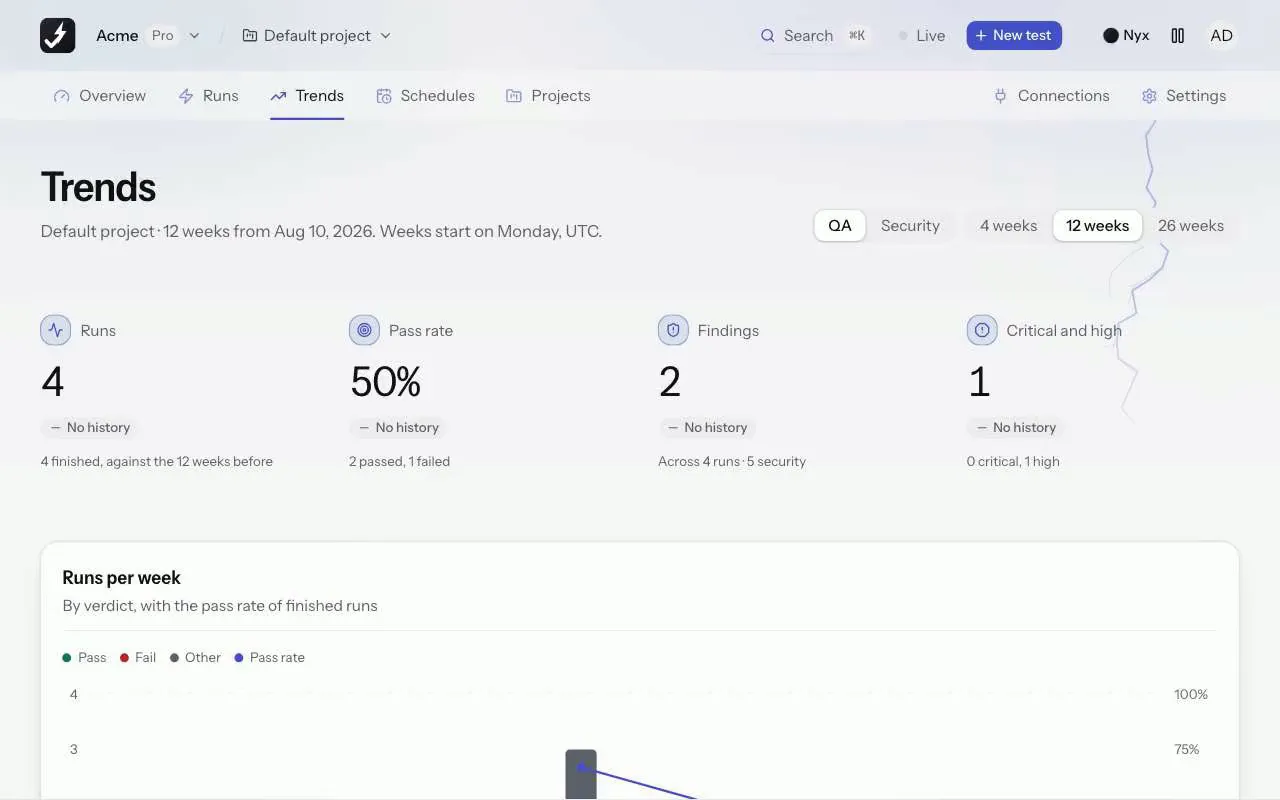
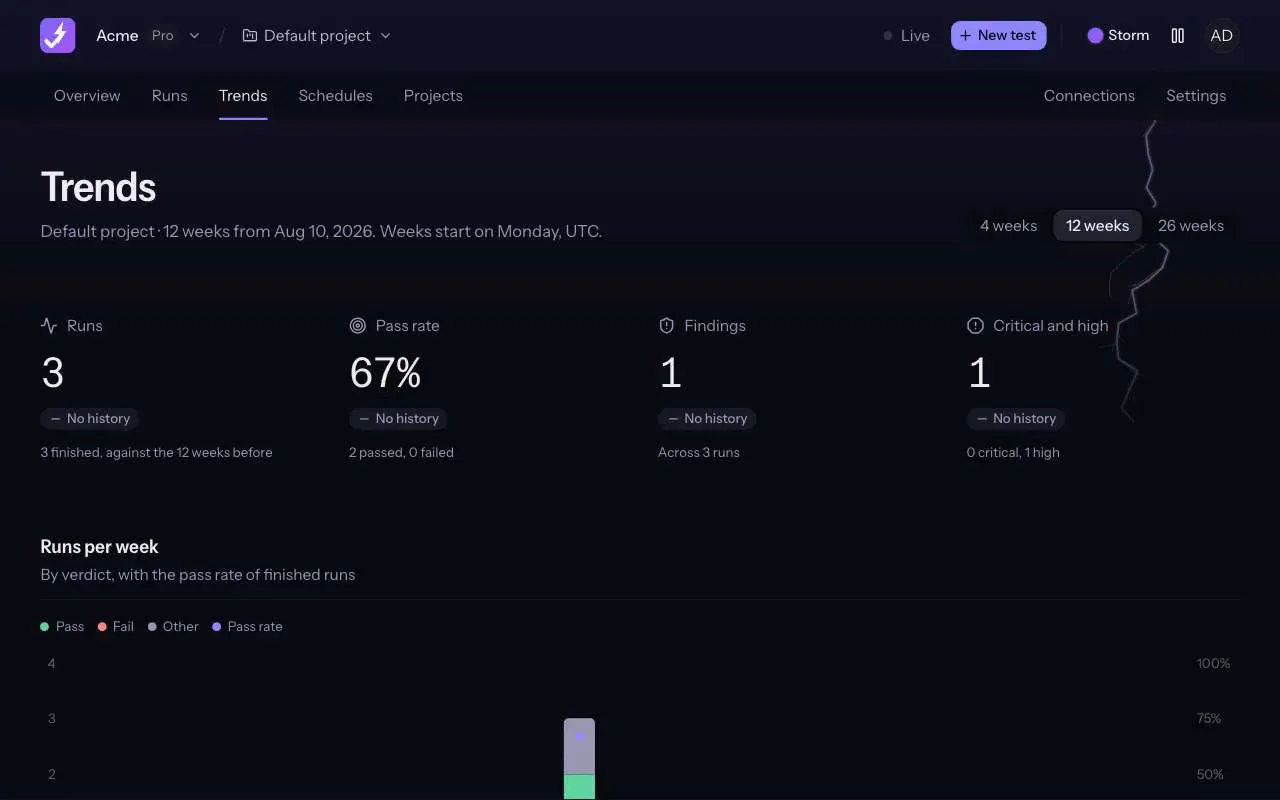
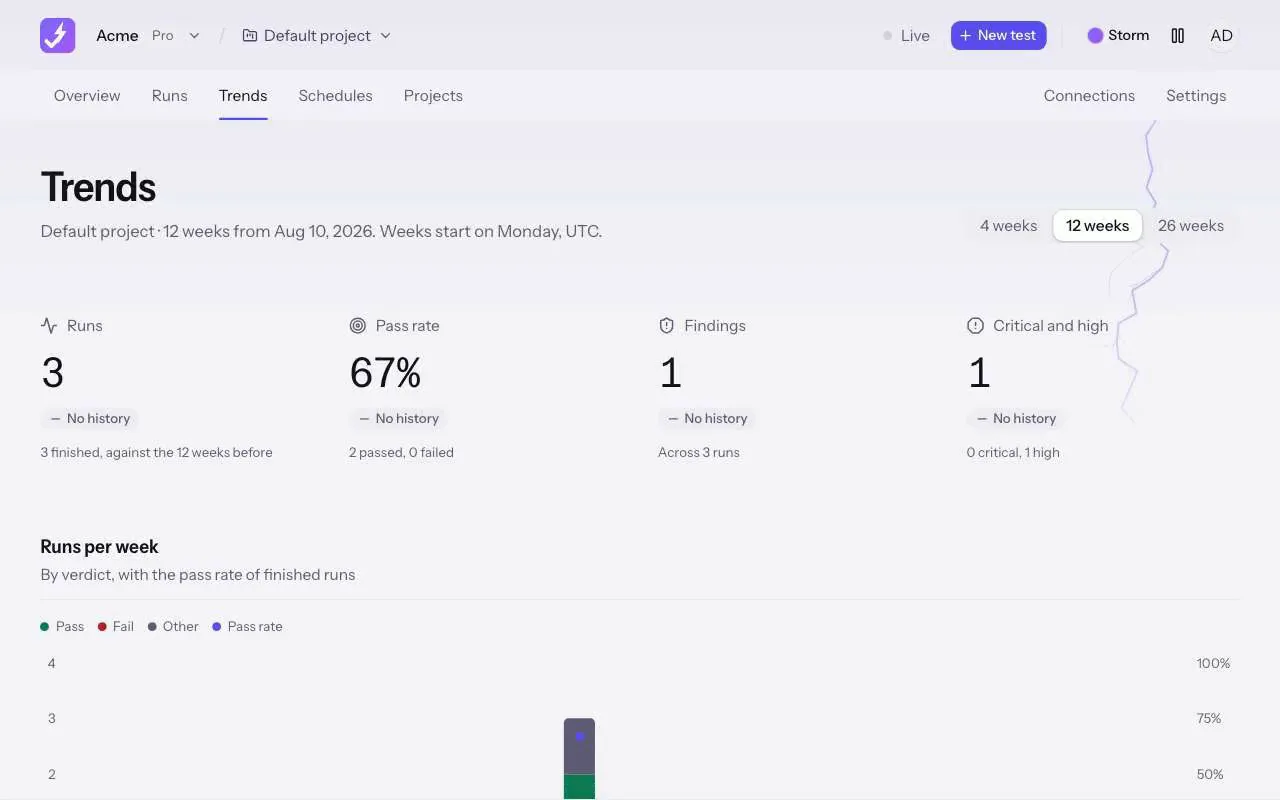
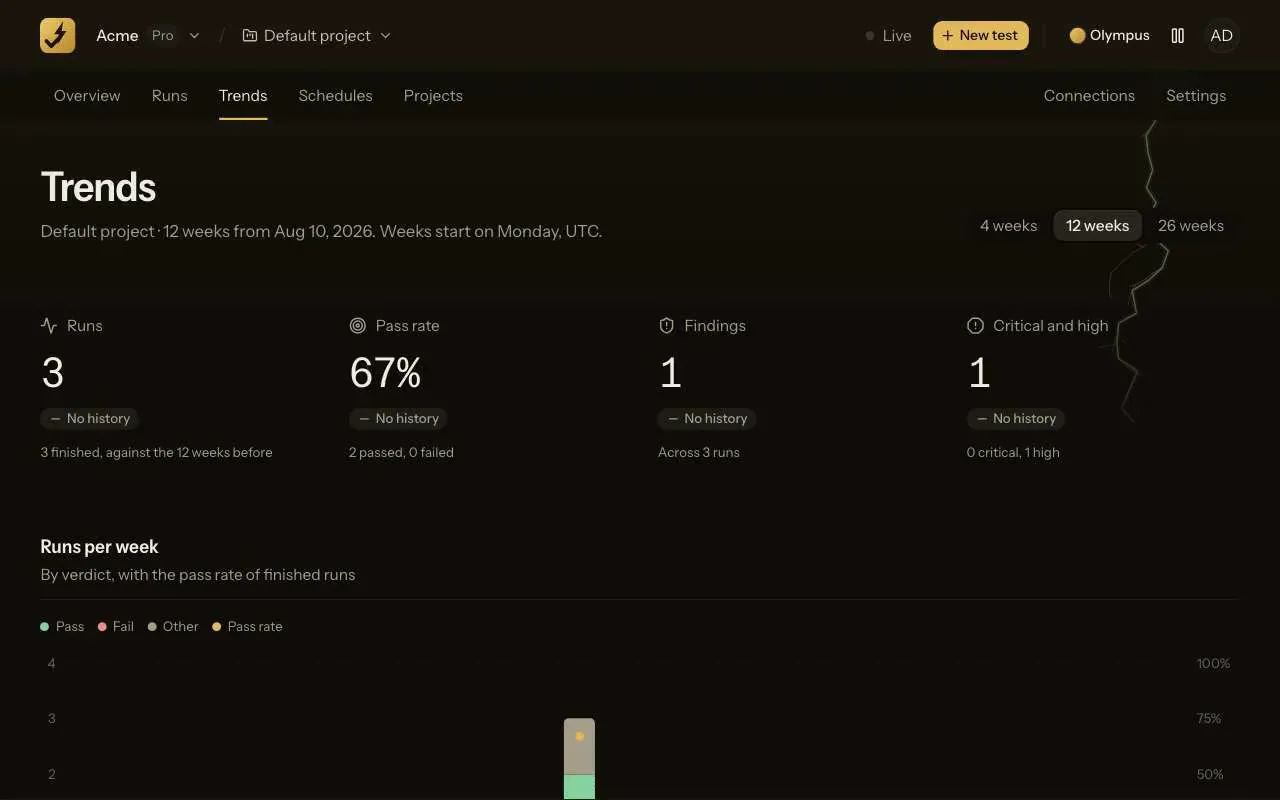
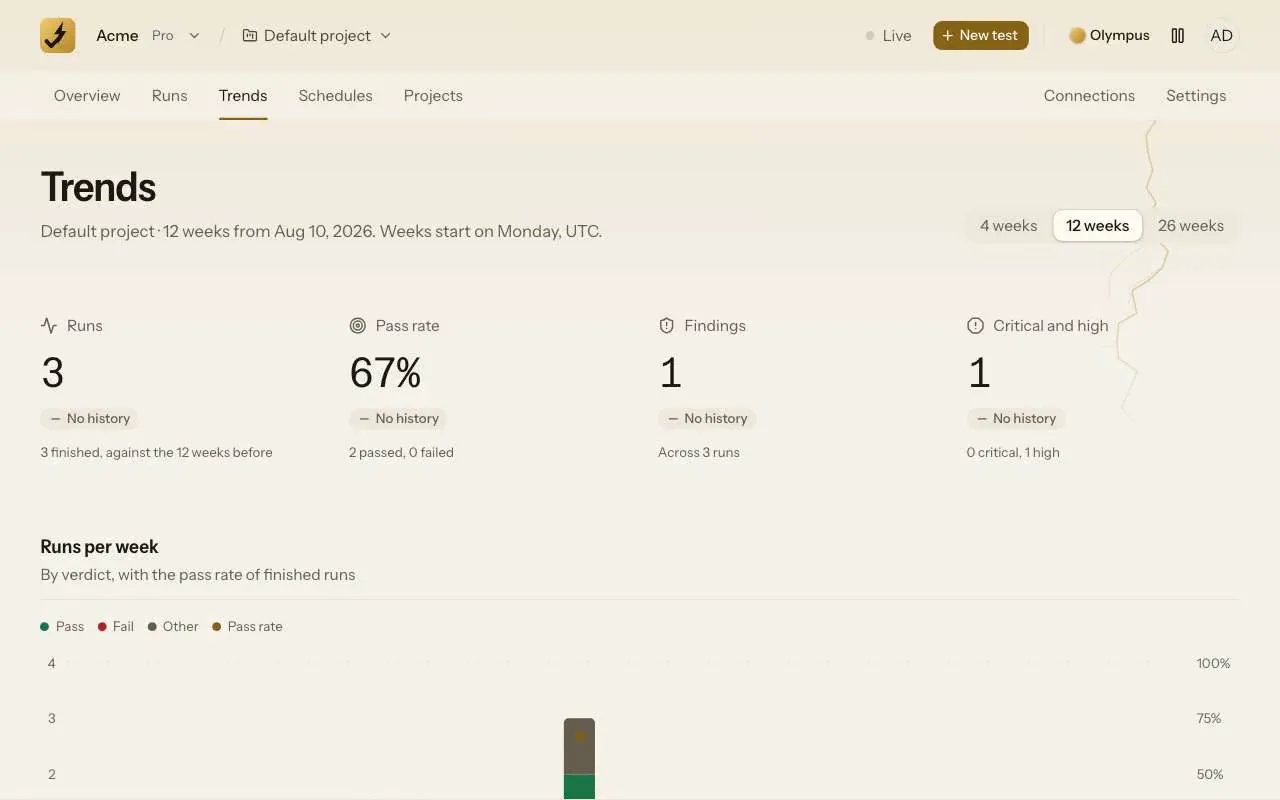
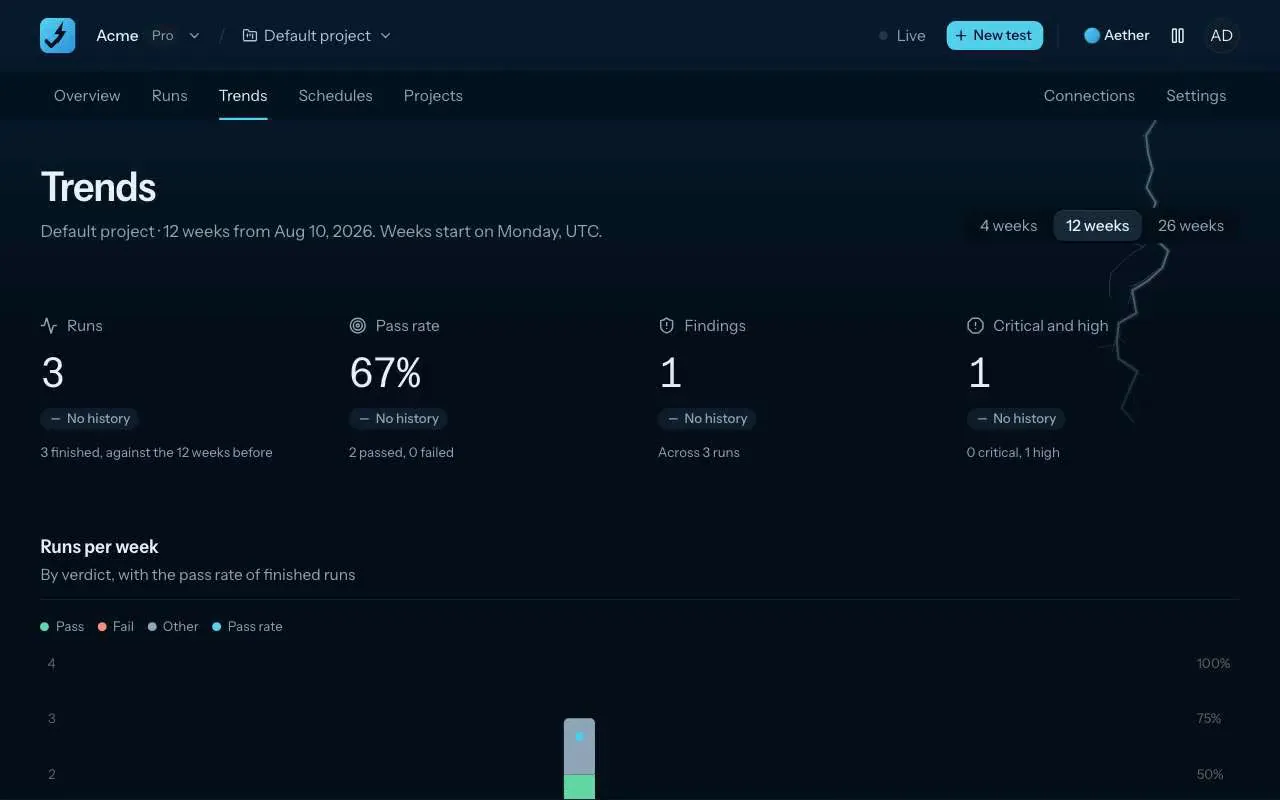
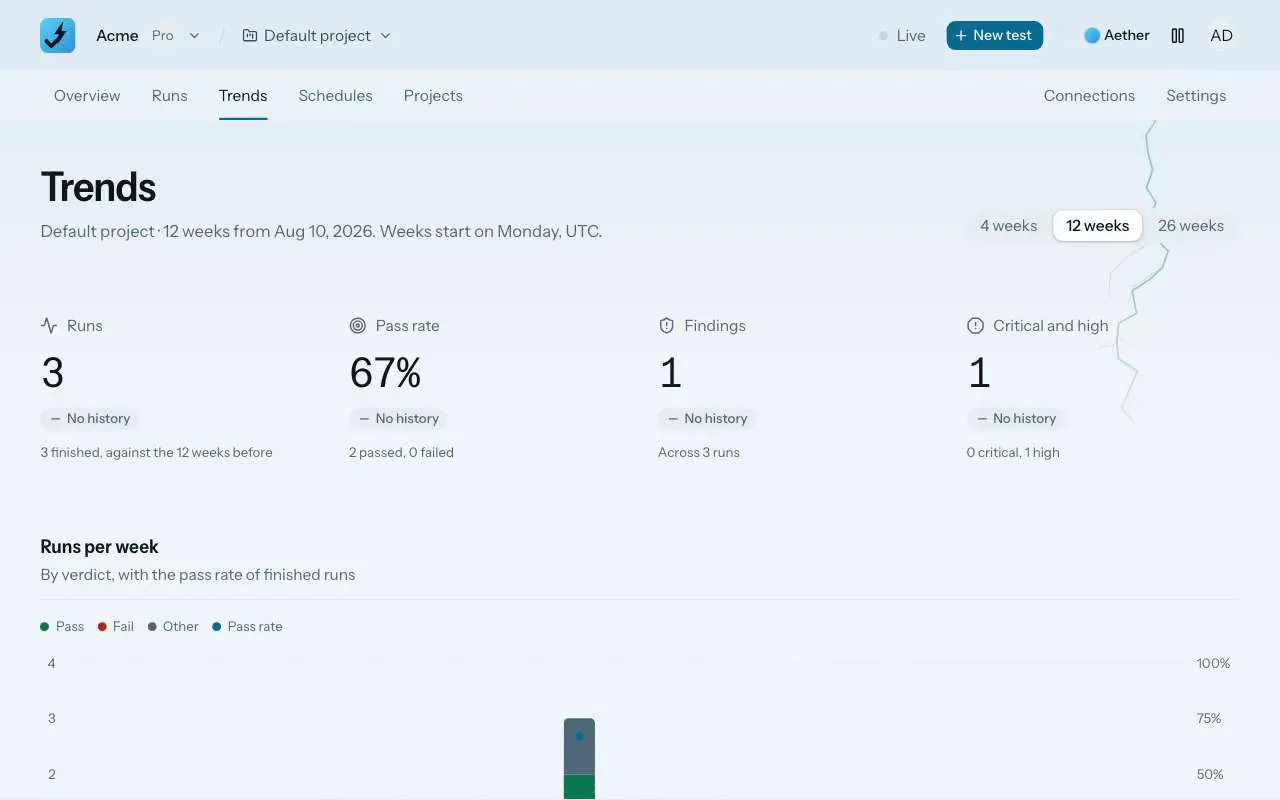
Runs per week, pass rate and findings by severity, with a CSV of each table.
The short answer
Trends counts every run in your workspace by week: runs by verdict with the pass rate of finished runs, findings by severity from critical to info, and four numbers against the period before. Pick 4, 12 or 26 weeks, narrow it to one project, and download either table as a CSV. Weeks start on Monday, UTC.
How it works
Run tests
From the app, a pull request or, on Pro and Team, a schedule. Every run counts; runs still in flight count towards runs, not towards the pass rate.
Open Trends
Pick 4, 12 or 26 weeks. The project switcher in the top bar narrows it to one project.
Export what you see
The By project and Week by week tables each have a Download CSV button that exports exactly the rows on screen.
What it counts
- Runs per week by verdict, with the pass rate of finished runs drawn over the bars.
- Findings by severity: critical, high, medium, low and info, week by week.
- Four numbers against the period before: runs, pass rate, findings, and critical plus high.
- Two tables, by project and week by week, with the same counts.
Every number is counted from your runs. Nothing is sampled or estimated.
Plans and where to find it
On every plan. Find it under Trends in the top bar of the app.
- Free
- 3 runs in total
- Pro, $39 a month
- 300 runs a month
- Team, $149 a month
- 1,500 runs a month
Runs from the app, from pull requests and, on Pro and Team, from schedules all count towards the plan. Compare plans.
What it does not do
- The longest period is 26 weeks.
- Weeks run Monday to Sunday in UTC, not in your time zone.
- It counts runs and findings. It does not measure page speed or uptime.
Release notes and posts
Trends, week by week
A new Trends tab shows runs per week, the pass rate over time and findings by severity for every project, with a CSV of each table.
Changelog · 30 October 2026
The pull request gets a tester
What ZeusQA shipped on 30 October 2026 for teams without a QA engineer, feature by feature, with what each one does not do yet.
Blog · 30 October 2026
Questions
Where do the numbers come from?
From your runs. A run in flight counts towards runs, not towards the pass rate, and findings are counted by the severity the report gave them.
Can I export it?
Yes. The By project and Week by week tables each have a Download CSV button that exports exactly the rows you see.
Can I see one project?
Yes. The project switcher in the top bar narrows Trends to one project.
Try it on your own site
Paste a URL, describe the flow in plain English, and watch a real browser do it. Three runs free, no card.